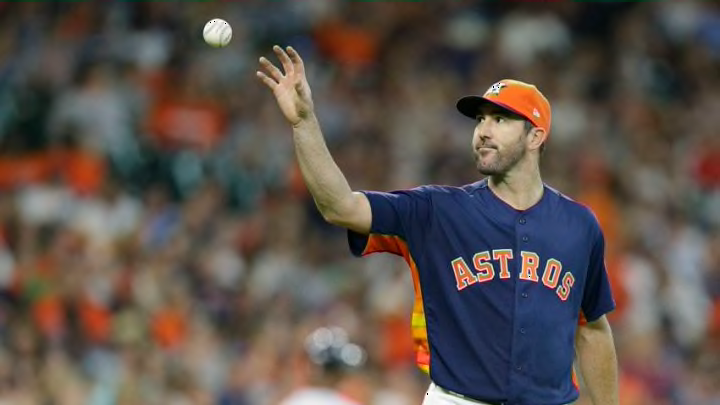
Does anyone ever need an excuse to look at Astros’ right-hander Justin Verlander‘s numbers? Are those crickets I hear? Yeah, I thought so.
If you follow the Astros, or baseball in general, you’re already likely a bit familiar with Justin Verlander’s journey to rediscover his previous dominant form. In some instances, he has looked even better than his best form with the Tigers. You can read further about the topic here or there or over yonder. Heck, why not this link? Sure, I might come across as lazy by posting four different links on the same subject, but those writers are much more efficient at writing than I am. You should read their work.
That said, I do feel the urge to share specific numbers behind Verlander’s pitch arsenal. Here are a few that jump to me, specifically with the right-hander’s fastball. Note: Pitchf/x leaderboards from Baseball Prospectus.)
- 11.24 inches in vertical movement (2nd-highest among all starters; 200 pitch minimum)
- 53.58% swing rate (7th-highest among all starters)
- 29.39% whiff per swing rate (7th-highest among all starters)
- 42% CS/Tk rate (14th-highest among all starters)
- 58% CS rate (14th-highest among all starters)
Separately, these numbers do not mean much, but it does indicate how well Verlander’s fourseam fastball moves and performs. For example, the pitch limited hitters to a .211 batting average and an 89 wRC+. While his fourseam is prone to end up a home run (18 total in 2018), the pitch remains one of Verlander’s best weapons on the mound.
For as much love as pitcher’s fastball receives, I am sometimes more impressed by the other offerings. In Verlander’s case, it is his curveball that has provided amazing results, although it doesn’t show up at the top in Pitchf/x leaderboards like his fastball. But the 2018 results, well, are something else.
- 2 wRC+
- .136 batting average
- 2 home runs allowed
- 17 total hits allowed
- 51.2% strikeout rate
Verlander’s curveball was a truly dominant pitch in 2018, which also happen to be his first full season with the Astros. Interestingly enough, Verlander threw his curveball not quite 80 times less than he did in 2017. The 495 times he threw the pitch in 2018 was the lowest amount since 335 in 2015. If he can post similar results in 2019, then the Astros have to feel good about the front-end of their rotation. On the flip side, I think I heard Verlander’s value in free agency climb even higher.
Next. Astros Morning Snippets: Young arms impressing in camp. dark
So, why do I bring all these numbers up? Honestly, it was for no particular reason besides sharing the information with you, the reader. I found these figures interesting and decided it was worth spending some time writing about. And, do I dare say, fun? Yes, I do like math, like, a lot.
While there wasn’t any earth shattering discovery or high-level analysis here, it does make you appreciate, even for a fleeting moment, how good a pitcher Verlander is. Especially when a curveball is involved.
