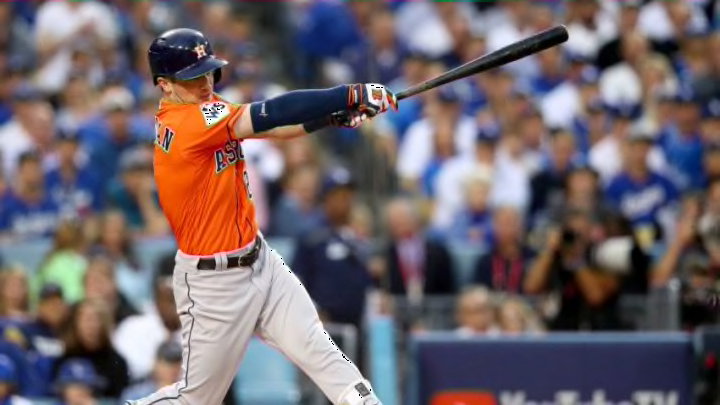
The Astros’ third baseman improved quite a bit as the 2017 season went on and on.
Like all of you, I was certainly impressed with Alex Bregman in 2017. The results speak for themselves. And the postseason highlights. Goodness, those postseason highlights. The Astros must be pleased to have the hot corner covered by such a young, confident talent.
And cheap. Let’s not forget about cheap.
Overall, Bregman was quite terrific in 2017. By wins above replacement, the former LSU standout posted a 3.8 fWAR and 4.1 bWAR. You’re not mistaken if you claim Bregman as one of the best third baseman last season. The numbers don’t lie in this case. If you sort by all qualified third baseman, Bregman’s 3.8 fWAR places him seventh. That’s not shabby.
To me, though, the most interesting aspect of Bergman was the sudden improvement in the power department midway through the season. Specifically, his isolated power. If you’re not familiar, here is Fangraphs definition of isolated power.
"Isolated Power (ISO) is a measure of a hitter’s raw power and tells you how often a player hits for extra bases."
You may wonder why am I so interested in Bregman’s isolated power. Well, for one, his ISO jumped from .163 in the first half of the season to .221 in the second half. That’s not just a slight improvement. Bregman literally became a better hitter. Another example: Bregman went from a 105 wRC+ to a 141 wRC+. A slightly above-average hitter to a bleeping definitely above-average hitter. Outside of Jose Altuve, Bregman likely was the best Astros hitter at one point. Remember that both Carlos Correa and George Springer missed time with injuries. Especially Correa.
In other news, baseball players are not allowed to slide headfirst any longer. Oh, if it only were that simple.
Bregman’s improvement in power partially derived from his ability to hit the ball harder.
Simple concept, right?
Anyway, his hard contact rate climbed nearly six percent. In turn, Bregman’s soft contact rate dropped by nearly five percent. This would also explain how his fly ball-to-home run ratio increased by nearly four percent while his overall fly ball rate actually decreased a percentage point between the two halves.
However, Bregman’s average exit velocity through July 23rd (87.3 MPH) and after July 23rd (87.8 MPH) didn’t change much, if any at all. Even his average launch angle hardly changed between the two halves. For example, he posted an average launch angle of 16.1 degrees through July 23rd and 16.2 degrees after July 23rd.
Next: Lance Berkman in retrospect. Where is the "Big Puma" now?
From a first glance analysis, it appears my original thought of Bregman just hitting the ball harder is somewhat true. His hard contact percentage did rise, however, the average velocity between the two halves didn’t show much variance. Launch angle doesn’t appear to a root cause as well. More careful and thorough analysis is needed, but this could be a good starting point.
**Statistics and information courtesy of Fangraphs, Baseball Reference and Baseball Savant**
